Introduction to No$GBA (aka GET TO DA DEBUGGAH)
The game’s assembly code resides in the beginning of the rom after the header, approximately the first 0xE0000 bytes. If you looked at it in your hex editor, however, it wouldn’t really tell you anything useful:
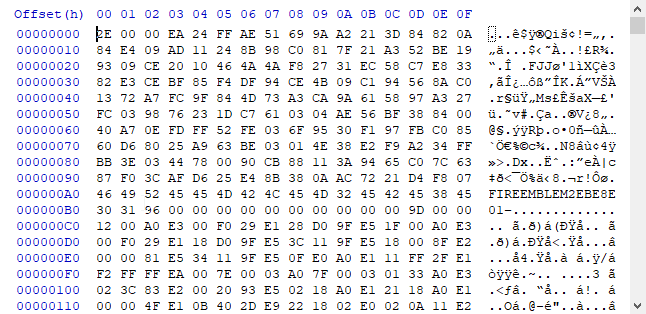
We need something to translate that string of hex into something that a human can parse. Enter… the debugger. For this guide, I will be using no$gba 2.8. The debugger is basically an emulator with extra tools that allow us to play God with our game, and understanding how to use it is key to being able to do assembly hacking. So let’s get right into that. Open the no$gba.exe executable.
![]()
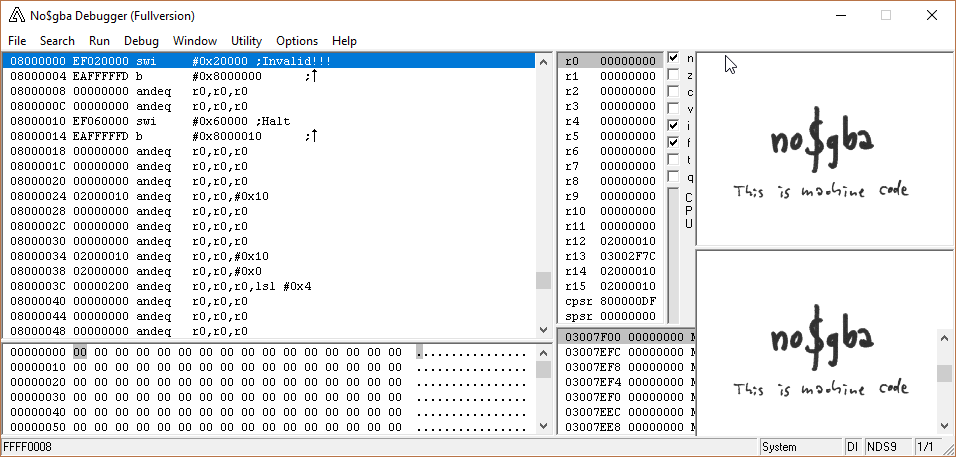
You should get a window that looks like this:
Go to File -> Cartridge Menu (FileName), navigate to your .gba file, and open it.
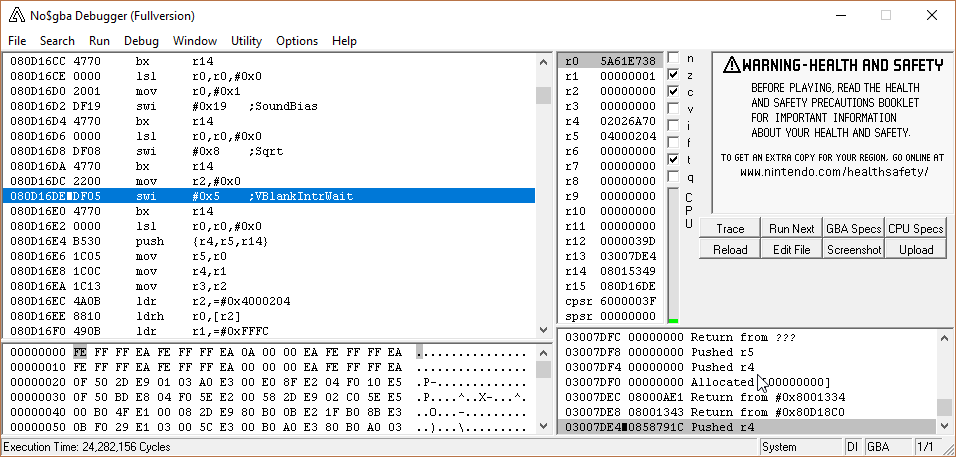
Voila!
Now I’m going to explain what each part is for.
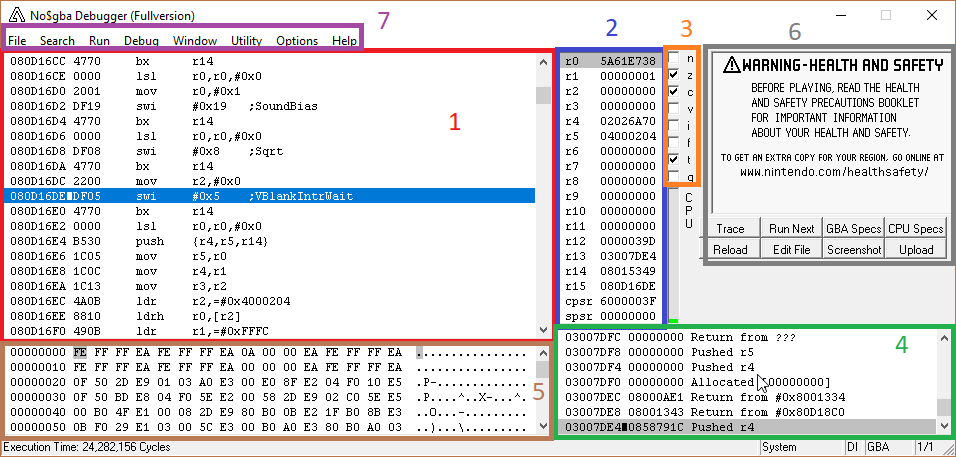
1) Main Window
This window shows the assembly code being executed. From the left:
- The first column is the address of the opcode. The first byte of the address (from the left, so 08 here) shows which memory block the code resides in (see Memory Blocks in the reference section). The 08 means rom. 99% of the code you will edit is in the rom. If you want to look at it in your hex editor, don’t forget to subtract 0x8000000 from the address!
See the little rectangle next to the address 80D16DE? That indicates that this opcode is next in line to be executed. - The second column is the hexadecimal representation of the opcode. If you go to D16CC in your hex editor, you’ll see this:

Notice that the bytes are reversed (4770 shows up as 70 47). That’s because of little endianness. - The third and fourth columns combine to form the opcode and its arguments.
-
band its variants have an up or down arrow to the right of the argument to show what direction the branch goes:

Similarly,blshows a right-facing arrow (although that doesn’t tell you which direction the call is):

You can use the right arrow key to be taken to the location that is branched to, and the left arrow key to return. Pretty handy, no? - Currently not displayed, but can be turned on by going to Options -> Debug -> Clock Cycle Comments. This is an indication of how long each opcode takes to execute. It’s not something I’ve ever had to worry about, since it’s aimed more at people building games from scratch.
You can edit an opcode by clicking the line and starting to type, which will bring up this box:
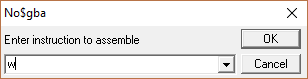
Once done, hit Enter. If you wrote a valid opcode, good for you! It should immediately change. If you didn’t, you’ll be faced with this box
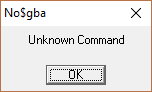
and may be forced to reevaluate your life choices. Or at least, stop making typos.
You can press ctrl + g to bring up the go-to window, enter the address (don’t forget the 8 in the beginning if it’s a rom address!), and hit Enter to be taken to that address.
Finally, you can select a line and press Enter once to center it, twice to put it at the top of the window.
2) Register list
This is, well, the register list. It shows the values of each 32-bit register. You can select a register by clicking on it, typing in the value, and hitting Enter. Note that if the value begins with a letter (ie, A-F), it must be preceded with 0x, otherwise you’ll get see this:
r13-r15 are reserved for specific tasks:
- r13, or sp, is the stack pointer, which is covered in more detail in section 4 (Stack).
- r14, or lr, is the link register, which is explained in the Branches section of the Opcode Glossary.
- r15, or pc, is the program counter. It points to the address of the next opcode to be executed.
The rest are yours to do with as you will, more or less; refer back to the Conventions section.
There are 2 more visible registers, which you should never have to touch: cpsr (current program status register), and spsr (saved current program status register). cpsr contains the flags for condition codes (see 3) Flags), processor mode, endianness state, interrupts, and other things that I have no idea about. spsr is merely used to hold cpsr's value during an exception. I mention these only for the sake of completeness; you will almost certainly never need to use these. In fact, just pretend they don’t exist.
3) Flags
In order from top to bottom:
- n: Negative condition code flag
- z: Zero condition code flag
- c: Carry condition code flag
- v: Overflow condition code flag
- i: IRQ (Interrupt Request) mask bit.
- f: FIRQ (Fast Interrupt Request) mask bit.
- t: Thumb execution state bit.
- q: Cumulative saturation bit, also known as the sticky overflow bit
The first four are used for conditional branches (see the Comparisons and branches section in the opcode Glossary).
I haven’t the faintest idea what i and f do; they seem to be related to another set of registers for interrupts.
The thumb flag is pretty obvious; it’s set if the processor is in thumb mode, which it currently is.
Lastly, q is similar to v, but once set, it’s not unset until you specifically unset it. I don’t think this is actually used, but can’t swear to it.
You can select or unselect any of the flags by clicking in the check box (and see the corresponding change in the value of cpsr). The only ones I recommend messing with are the condition branch flags, since sometimes you’ll want to see what happens when a branch is taken (or not). Definitely don’t touch the thumb flag, because that will bring everything to a screeching halt.
4) Stack viewer
The stack is a block of memory that used to hold register values that we need to save. Think of it as a bunch of books piled one on top of another. Normally, stacks are LIFO, or last in, first out, structures; the last book to be placed on the stack is the first to be removed, and if you want to access a book in the middle of the stack, you must first remove all the ones on top it.
In our example, each book is a register’s contents, which is 32 bits. We add a ‘book’ to the top of the stack with the push opcode, and remove a book by popping the book into a register.
Now, let’s say that you want to access a specific value in the middle of the stack. With a normal stack, you’d have to remove everything above said value. However, we have a stack pointer, which usually points to the topmost value on the stack. And since it’s a value like any other, we can manipulate it to retrieve values in the middle of the stack.
Notice I said that the stack pointer usually points to the top of the stack? That’s because sometimes it’s useful to reserve space on the stack to temporarily store values. To do this, we merely subtract a constant from r13, and voila! Note that the constant has to be divisible by 4.
Hold up, you say. Subtract a constant? Why would we subtract? Well, if you look at the leftmost column in the image, you’ll notice the addresses are ordered in decreasing order. In other words, the stack grows downwards. Why? Because the concept of the stack was invented in 1973 by an Australian person, and they can never do anything the proper way (MOD EDIT: This is totally untrue and I will be suing for defamation of character - Circles).
Ok, the actual reason is because the stack and another structure called a heap would occupy the same block of memory in an operating system. To maximize space efficiency, the heap starts at the bottom (smallest memory address) and grows upwards, and the stack starts at the top (largest memory address) and grows downwards. This is better than allocating half the space for each, since sometimes the heap needs a lot of memory, but the stack doesn’t, or vice versa. Of course, if both require a lot of space at the same time, then you get trouble in the form of a stack-heap collision. Note that you don’t have to worry about this here, since we don’t have a heap to worry about.
That being said, it is technically possible to overwrite other things. If you look at the addresses, you’ll notice they have the 03 prefix (the stack begins at 3007DFC), which is IRAM. There’s most definitely other data in there. If you raise the stack enough, you will eventually run into this data. Should you be concerned about this ever happening? Not really. If you are actually getting overflow errors, that probably means something else has gone horribly wrong.
The middle column, as you might guess, contains the value at the address.
The right column describes what action was taken when copying the value. Return from means that r14 (the link register) was pushed, while any other register being saved merely says Pushed {reg}. If space was allocated, then it says, well, Allocated.
5) Memory/Breakpoint Viewer
The image currently shows the memory viewer, so we’ll cover that first. It’s essentially identical to your hex editor, except you can edit any section of memory. Click in the area, press ctrl + g to bring up the Go-to window, enter the address, and press enter. You can even write the hex representation of your assembly code, if you really want to (I don’t recommend it unless it’s very short).
If you press Tab, you’ll switch to the breakpoint window, which currently looks like this:
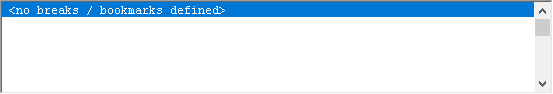
Breakpoints are important enough to warrant their own section, so go look at that. Press Tab to toggle between the memory and breakpoint viewers.
6) Game Window + buttons
The game window is pretty obvious. You can have a second window pop up when the game is active by going to Options - Emulation Setup - Execute Games In - Separate Game Window if you prefer. To make the game active, click in the window; to pause, click outside the window or press Escape.
Of all the buttons under the game window, the two most important ones are Trace and Run Next. Trace executes the next opcode and halts. Run Next does the same, except when it encounters a bl, or function call (see Comparisons and branches in the Opcode Glossary). Trace will take you into the function after executing the bl command, while Run Next executes the entire function and halts at the opcode after the bl. In the bottom left corner, there will also appear a cycle count, which indicates how long it took to execute the function.
![]()
Note: Trace won’t execute swi, or software interrupts (such as that VBlankIntrWait we’re currently paused on), but Run Next will.
Reload, uh, reloads the game. Useful if you’ve royally screwed up and everything is on fire. Which will happen far more often than you’d like. Alternately, you’ve made changes to the rom and need to reload for them to take effect.
Note: You will accidentally click Reload instead of Trace. I’ve lost track of how many times this has happened to me, and yes, it is incredibly infuriating. You may wish to use the keyboard shortcuts instead: F7 for Trace, F3 for Run Next.
Also, savestates are your friend.
GBA Specs and CPU Specs bring up some handy-dandy no$gba doc. It’s basically a shorter and much more complicated version of this guide.
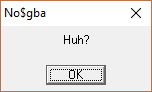
I’ve not used the remaining 3 buttons ever. Screenshot is probably fairly obvious, but I use ShareX for that. Edit Files allows you to edit your .asm files (which we’ll be writing later) with a built-in text editor, which is cool, but it’s not as nice as Notepad++ or Sublime. As to Upload, I have no idea what it does, since clicking it gives me this error:
Make of that what you will.
7) Menu bar
I won’t cover all the menu options here, only the ones I deem important.
- Roms that you’ve recently used will appear under the File menu, although you may need to close and reopen the rom for it to appear on the menu.
-File - Write snapshot (or Ctrl + W) will create a savestate with the .sg1 file ending. As far as I can tell, you can’t make a savestate while the game is active, which is somewhat annoying. - File - Load snapshot (or Ctrl + L) will load a savestate. As with creating a savestate, the same must be paused. Give your savestates a good name so that you’ll know what it’s for later.
- Strictly speaking, not a menu option, but still relevant: no$gba creates save files (.sav) in its Battery folder, not in the rom’s directory like VBA does. You can copy a VBA .sav and put it in the Battery folder; just make sure the rom isn’t running at the moment, otherwise the save file will be overwritten due to FE’s autosaving.
- In Window, the first 6 options all end up opening the same window, but on different tabs:
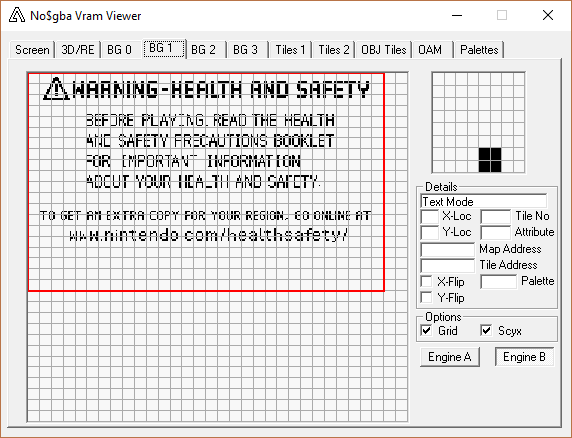
This is extremely useful for graphics-related assembly hacks, although those may be a bit challenging for a brand new hacker. Graphics alone deserve a guide of their own; fortunately, one that has already been written by someone far more knowledgeable than I, and can be found here (along with a lot of other useful stuff). - Utility - Disassemble to File will bring up a box to select the number of bytes to disassemble. It begins with the address at the top of the main window, not at the highlighted line! The diassembled file is a .dis, which can be opened in a text editor.
- Options: Play around with these if you’re not happy with the current layout. You can also disable layers here if you need to, which is something VBA can do with a keyboard shortcut. Under Debug, I personally prefer setting the Disassembler Syntax to Nocash Z80/X86 style, since that’s what I’m used to (I find it easier to read), but will use Native ARM/C64-style for this guide since that is the syntax that devkitARM expects. Less confusion down the line and all.
- You can check out the other menu options at your leisure; as far as I know, none of them should break everything horribly if you don’t know what you’re doing. And if the game does break, just reload the emulator.
NOTE: If you make changes to the rom, either via memory viewer, or by writing code into the main window, the changes will NOT be saved if you hit Reload or close the emulator. This can be a good thing; if you wrote the wrong thing somewhere and the game locks up, reload and everything’s back to normal. On the other hand, if you made a change that you actually want to keep, you’ll need to change it in the .gba file yourself.
Breakpoints
Breakpoints
When the game runs, there’s hundreds of thousands of opcodes executed every frame, meaning the odds of manually pausing the game when it executes a certain command is basically zero. This is where breakpoints come in. When you set a breakpoint, the game will halt when the breakpoint’s conditions are met.
There are a few different kinds of breakpoints that we can use. The trick is figuring out which one to use to get the information that you need.
Break on execution
A break on execution is set on an opcode at an address. To set one, you can either press Ctrl + B, write the address (don’t forget the 8 if it’s a rom address), and hit enter, or navigate to the line in question and click it twice (once if it’s already selected) or press F2. The line should change color and say BRK on the right side:
![]()
That’s it! If an opcode has a breakpoint on it, the game will halt on that line, ie, before execution.
If you want to set a break on the currently highlighted line with the breakpoint window, you can use $ instead of the address (useful for conditional execution breaks, see below).
Break on read/write
You can break on read or write to a place in memory, which will be using ldr or its variants for reads, and str and its variants for write. To set a break, press Ctrl + B, and write the address with brackets around it, and the appropriate ending:
? is a break on read
!! is a break on write
! is a break on write if the new value is different from the old
!? or !!? is break on both read and write (write adhering to the same rules as above). The order of ! and ? don’t matter.
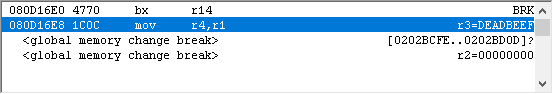
So if I want to set a break on read to 202BCFE, I would write [202BCFE]? in the Set Breakpoint box.
You can also set a break on read/write to a range of memory. Simply put the two addresses in brackets, separated with 2 periods:
[202BCFE..202BD0D]? will break upon reading any value between those two offsets, including the endpoints.
Note that the game will pause after executing the command that did the read/write.
Other/conditional breakpoints
You can set conditions to a break. For instance, you might want to break on the current line only if r2 is 0. Simply press Ctrl + B, enter your address (you can use $ for the current line), and separate the conditions with a comma, like $, r2 = 0.
You can also use the conditions by themselves: a break when r2 = 0 would be written as r2 = 0. Of course, that will almost certainly bring up a ton of false breaks if you’re looking for a specific instance of r2 = 0, but that’s part of the fun! Right? …Right? Ok, I guess it’s not fun, but you’ll have to put up with it anyway. Also, please note you can only have one break on execution per address, and only one condition per breakpoint.
All breakpoints will appear in the breakpoint viewer:
You can remove one by selecting it and pressing Delete, or clear them all by pressing F10. You can have a maximum of 10 breakpoints at any one time. If a breakpoint causes a halt, the responsible one will be highlighted.
Please note that if you close the emulator, or it crashes, your breakpoints will not be saved. It may be useful to write down important ones in case such an incident happens.