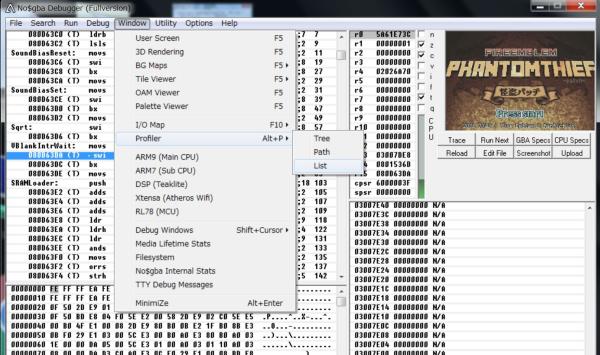
You can use the no$gba-debugger profiler to create a profile for GBA Game.
how to play.
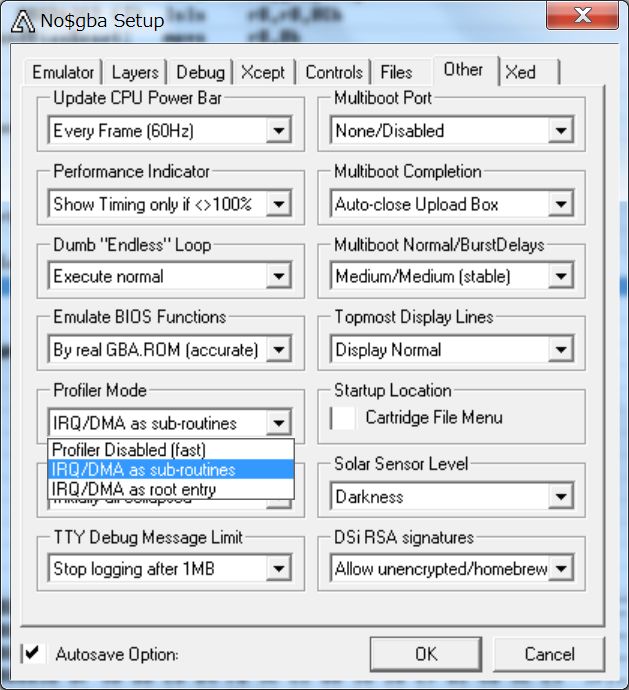
1.Enable profile from Option of no$gba debugger.
2.Advance the game.
3.View the results of Profile.

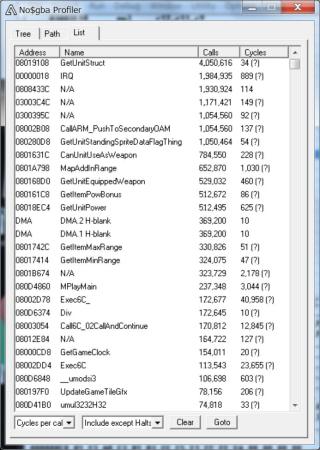
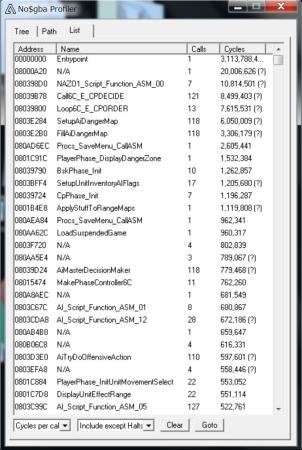
Profile result when playing a stage with many enemies with a kaitou patch for several turns.
This is the result of FE8J.
You can sort by clicking the list header.
Calls (number of calls to the function)

Cycles (time-consuming functions).

What you will know from now on.
-
The GetUnitStruct function is called in large numbers.
However, the GetUnitStruct function is NOT a very time-consuming process. -
The SetupAiDangerMap and FillAIDangerMap functions are called 118 times, but they are quite time consuming.
-
The CanUnitUseAsWeapon and GetUnitEquippedWeapon functions are also called in large numbers, so I don’t think it is a good idea to hook these functions.
Is SkillSystems hooking these up okay? -
MapAddInRange is also called a lot, and it takes a lot of time.
-
Exec6C (FE task system) is costly to maintain.
I think it can’t be helped because it is a complicated system. -
__umodsi3 (probably mod calculation) is called a lot, but it doesn’t take long.
It’s early for division. The power of hardware?
Notes on how to read Profile.
The parent function is affected by the child function.
For Example, The EntryPoint is shown as the most time consuming process, as it is the first routine called.
What we need to investigate is a function that is called a lot and is slow.
Problems with no$gba profiler.
For some reason no$gba profiler does not have the ability to export the results to a text file.
